
Feature Focus: Custom Portfolio Segmentation
How the custom portfolio segmentation works
This new customizable segmentation capability allows Portfolio Managers to create and display results of their own segmentation configuration for better prioritizing actions and decisions on their application portfolio, extending the product to new possible use cases.
How application segments are calculated
For each application having scan results, CAST Highlight blends relevant Software Intelligence insights, weights, and benchmarks together to determine a recommended segment. The segment calculation is quite simple. For a given application, CAST Highlight evaluates each segment criteria separately and gives points to these segments. These segment points accumulate and the one with the highest point count will be the recommended segment.
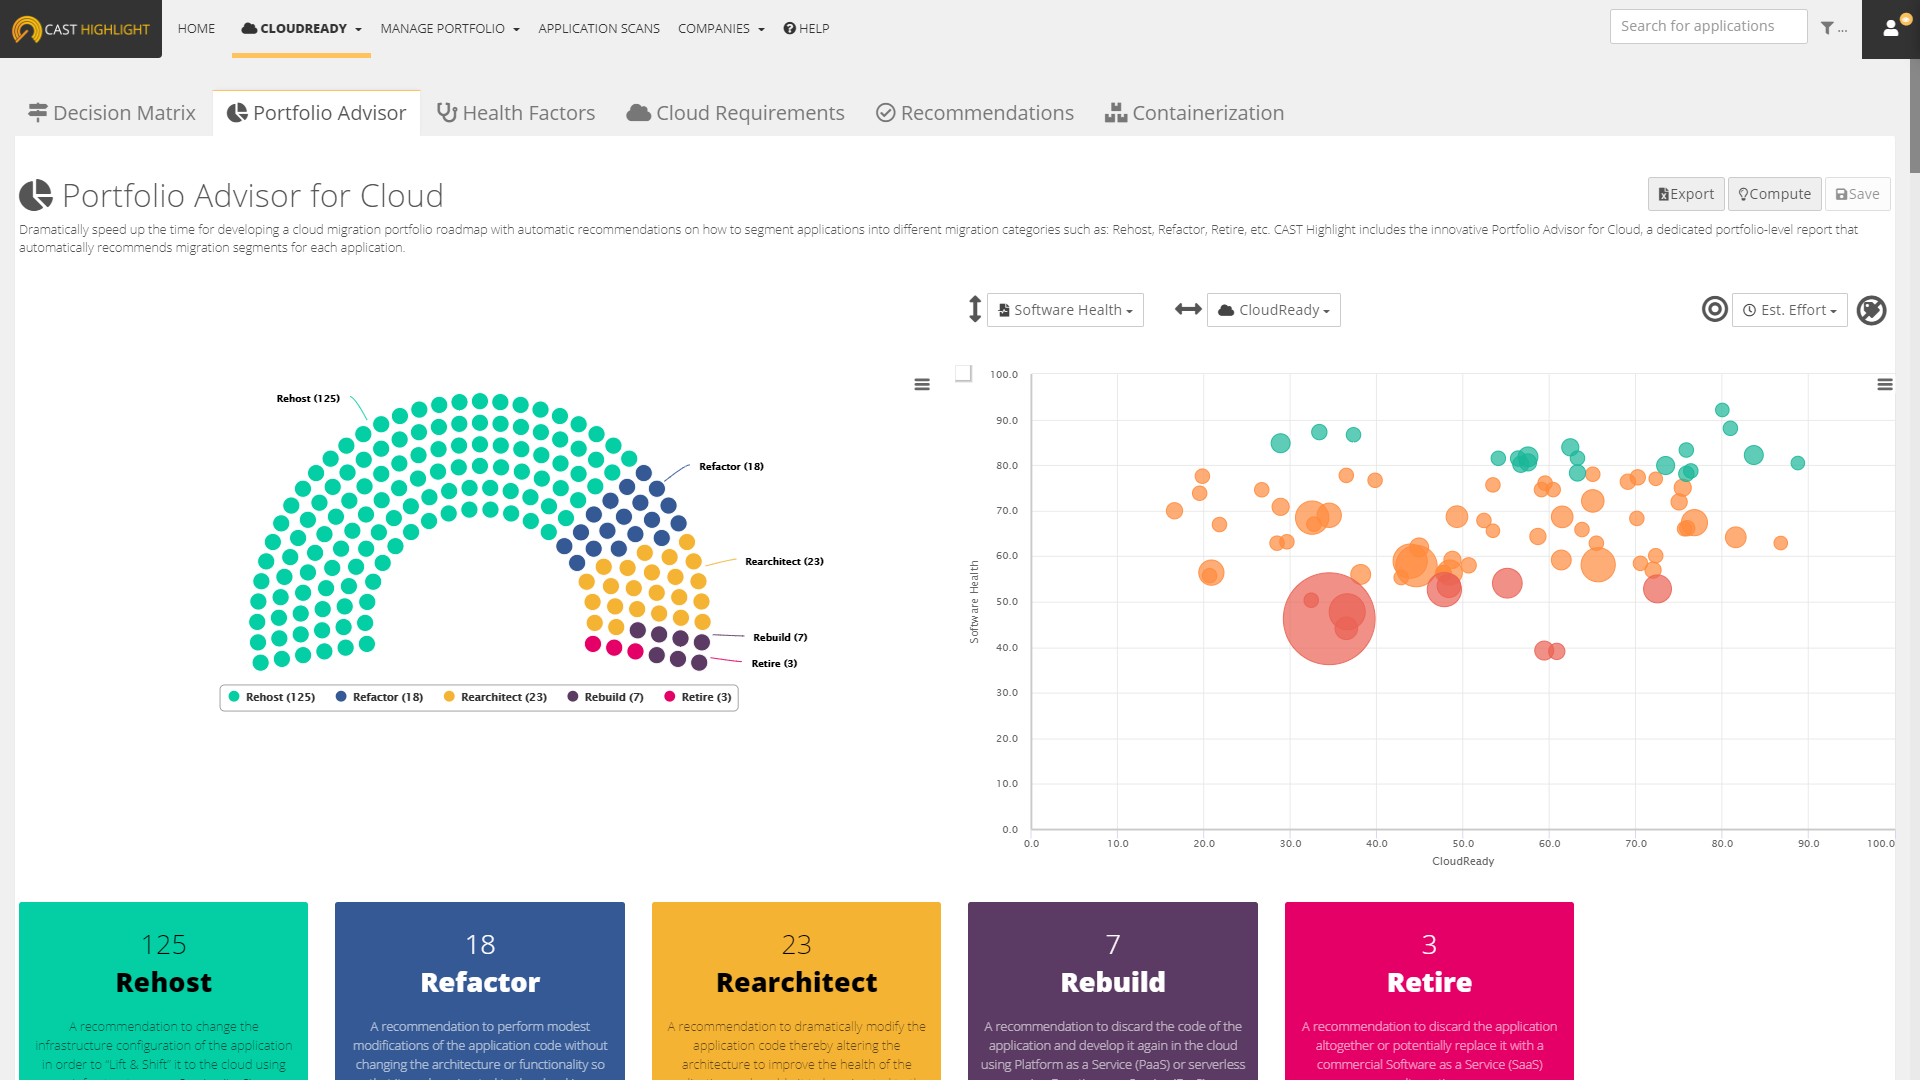
After reading this article, you will be able to produce new segmentation dashboards like the one below.
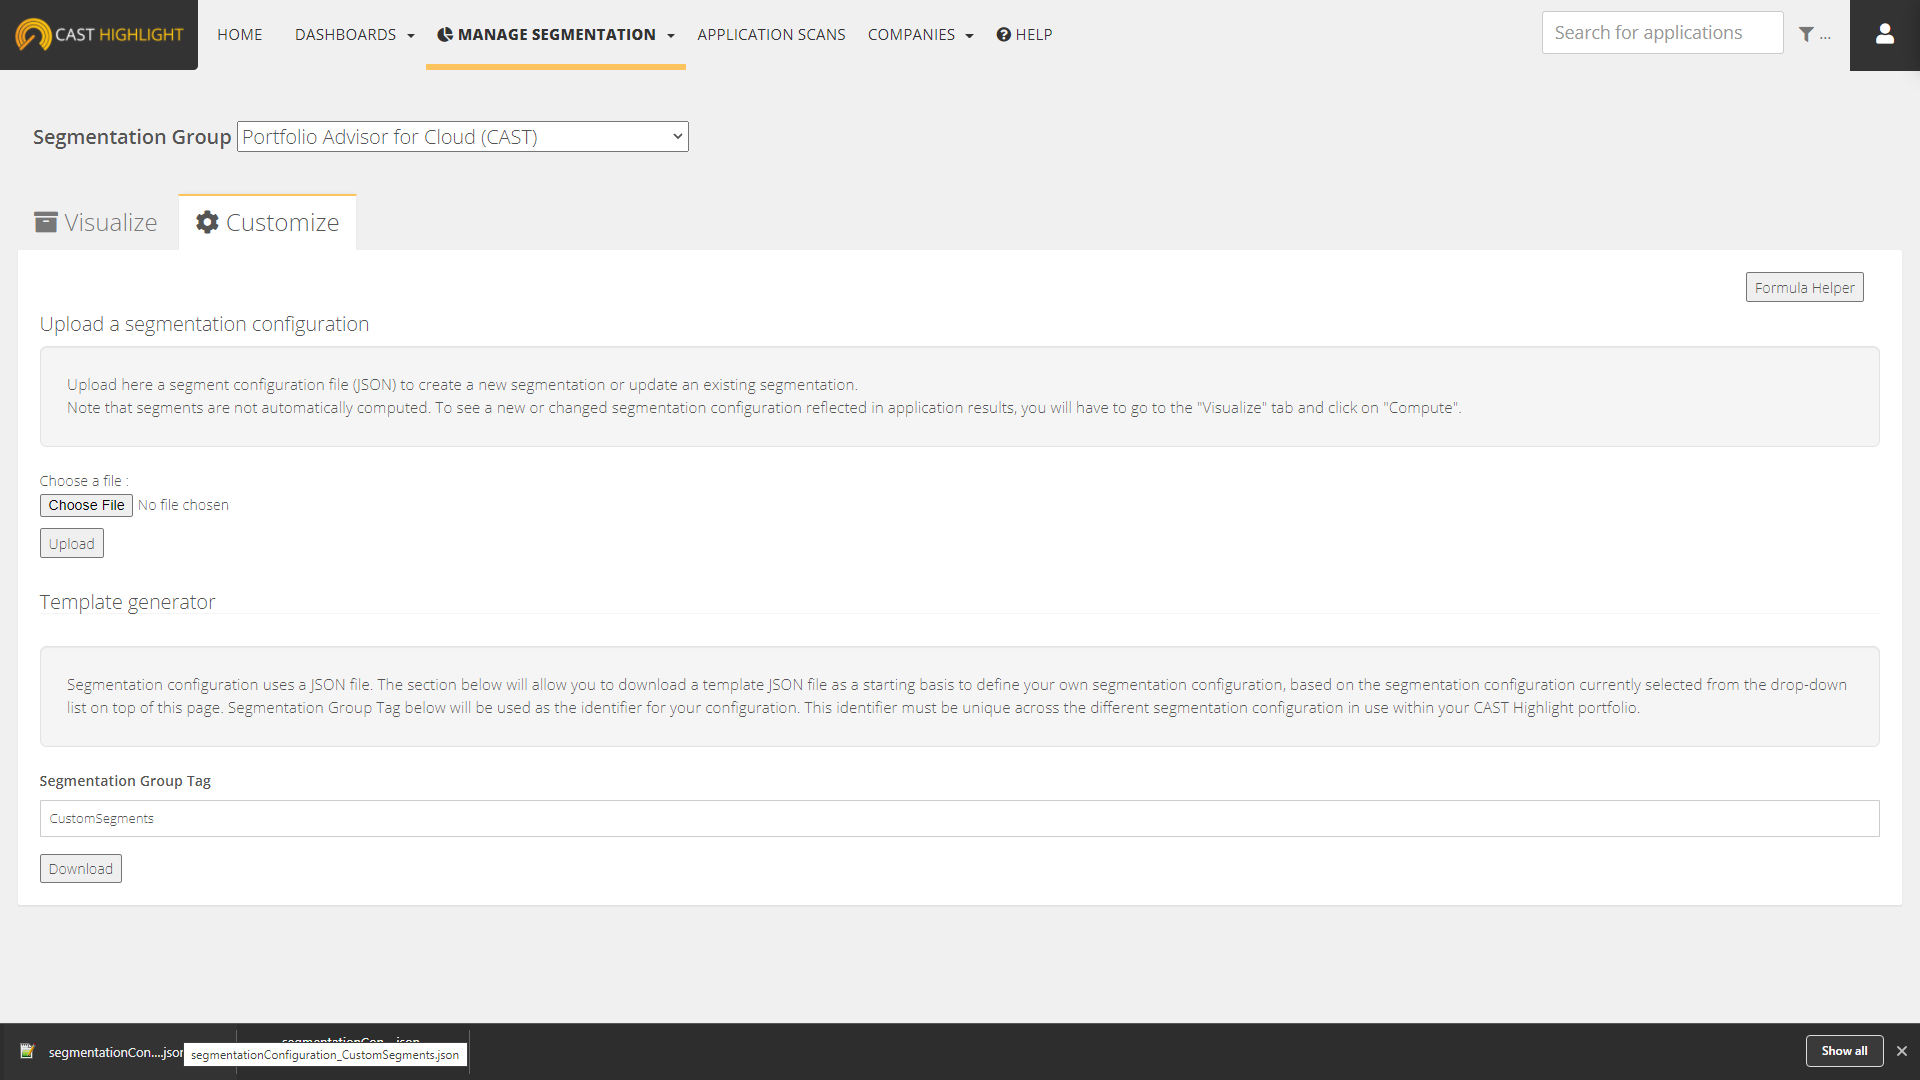
As a Portfolio Manager at the root-level domain of your instance, navigate to MANAGE PORTFOLIO > Manage Segmentation page from the menu, then click on the “Customize” tab.
To start your segmentation configuration from an existing configuration, select one of the available segmentation configurations from the drop-down list at the top of the page. Now, under the “Template Generator” section, type a Segment Group Tag (this will be the identifier for the new segmentation configuration you’re creating) and click on “Download”. This identifier will be automatically embedded in the generated segmentation configuration so that it is unique within your portfolio.
Once downloaded, open this .json file. You’re ready to start configuring your custom segmentation!
Alternatively, you can download a JSON configuration from our extensions marketplace.
Structure of a segmentation configuration file
A segmentation configuration file is a JSON file that is structured with the following elements:
- segmentationGroupRef: the unique identifier of your segmentation configuration
- name: short name of your segmentation configuration as it will be displayed in the dashboards
- description: long description of your segmentation configuration as it will be displayed in the dashboards
- segments (1 to n elements in segments)
- segmentRef: the unique identifier of the segment
- name: short name of the segment (will be displayed in the dashboards)
- description: description of the segment (will be displayed in the dashboards)
- color: hexadecimal color of the segment (e.g., #ffc600 for yellow)
- matchingRules (1 to n elements in matchingRules)
- description: description of a segment criterion
- formula: formula to evaluate a segment
- points: points allocated to a segment if the formula is verified for an application
- segmentationStatus: status of the segmentation configuration (“draft” status won’t expose the segmentation results in the dashboards / ”production” status will expose the segmentation results).
{
  "segmentationGroupRef" : "CustomSegments",
  "name" : "Name of your segmentation configuration (e.g. Portfolio Segments for Cost Optimization)",
  "description" : "Description of your segmentation configuration which will be displayed in the custom segmentation dashboard.",
  "segments" : [ {
    "segmentRef" : "CustomSegments_seg_1",
    "name" : "A first segment name",
    "description" : "A description for this first segment.",
    "color" : "#03CEA4",
    "matchingRules" : [ {
      "description" : "Low Business Impact",
      "formula" : "BI < 30 and BI =is= notnull",
      "points" : 10
    } ]
    },
  {
    "segmentRef" : "CustomSegments_seg_2",
    "name" : "A description for a second segment",
    "description" : "Description of your second segment.",
    "color" : "#345995",
    "matchingRules" : [ {
      "description" : "Low or Medium Business Impact",
      "formula" : "BI > 0 and BI < 50 and BI =is= notnull",
      "points" : 20
  } ]
} ],
"segmentationStatus" : "draft"
}
For defining segment matching rules, you will need to define the CAST Highlight metrics to be evaluated in segment formulas. Below is the list of the metrics and their corresponding identifiers that you can currently include in the configuration:
| Metric name | Identifier |
|---|---|
| Lines of code | Global Lines of Code: LOC (e.g., LOC > 10000) Lines of Code of a specific Technology: technology:LOC:{technologyIdentifier} (e.g., technology:LOC:JAVA > 10000) |
| Business Impact | BI |
| Full-Time Equivalent | FTE |
| Software Health | Health |
| Software Resiliency score | Resiliency |
| Software Agility score | Agility |
| Software Elegance score | Elegance |
| Technical Debt (effort in minutes) | TechDebt > 50000 |
| Technical Debt Density (effort in minutes per line of code) | TechDebtDensity <= 1 |
| Cloud Maturity score | CloudMaturity |
| Cloud Maturity Scan score | CloudScan |
| Cloud Maturity Survey score | CloudSurvey |
| Cloud Maturity Blocker score | CloudBlocker |
| Cloud Maturity Booster score | CloudBooster |
| Cloud Maturity Estimated Effort | CloudEstEffort |
| Cloud Maturity total roadblocks | CloudRoadblock |
| Cloud Maturity blockers by Impact level | Examples: cloudRuleImpact:CODING == 0 cloudRuleImpact:FRAMEWORK > 0 cloudRuleImpact:ARCHITECTURE < 50 |
| Cloud Maturity Containerization blockers by Impact level | containerizationRuleImpact:CODING == 0 containerizationRuleImpact:FRAMEWORK == 0 containerizationRuleImpact:ARCHITECTURE == 0 containerizationRuleImpact:CONTAINER == 0 |
| Cloud Maturity blocker occurrences by Impact level | Examples: cloudRuleImpactOccurrences:CODING == 0 cloudRuleImpactOccurrences:FRAMEWORK > 0 cloudRuleImpactOccurrences:ARCHITECTURE < 50 |
| Cloud Maturity Containerization blocker occurrences by Impact level | containerizationRuleImpactOccurrences:CODING == 0 containerizationRuleImpactOccurrences:FRAMEWORK == 0 containerizationRuleImpactOccurrences:ARCHITECTURE == 0 containerizationRuleImpactOccurrences:CONTAINER == 0 |
| Open Source Safety score | OSS |
| Open Source Safety License Compliance score | OSS_license |
| Open Source Safety Security score | OSS_cve |
| Open Source Safety Obsolescence score | OSS_obsolescence |
| Count of Critical CVEs | CriticalCVE |
| Count of High CVEs | HighCVE |
| Count of Medium CVEs | MediumCVE |
| Count of Low CVEs | LowCVE |
| Count of Advisories | Advisories |
| Count of KEV CVEs | KevCVE |
| Count of OSS components | SCA:count (e.g., SCA:count > 100) |
| OSS Component name matching | E.g., SCA =in= (log4j:log4j,sl4j:sl4j) |
| Green Impact score | GreenImpact |
| Green Impact Scan score | GreenScan |
| Green Impact Survey score | GreenSurvey |
| Green Effort | GreenEffort |
| Custom Indicator scores | CID{CustomIndicatorId} (gotten when custom indicator is created from the UI, e.g., CID10064191) |
| Application-level Survey answer | If it is a CAST standard question: QUESTION_REF_{questionRef} =in= ({questionRef}-{answerRef}) Example: QUESTION_REF_CAST_BI_NBRELEASE =in= (CAST_BI_NBRELEASE:LT3,CAST_BI_NBRELEASE:4TO6) If it is a custom survey question: QUESTION_ID_{questionId} =in= ({questionId}-{answerId}) Example: QUESTION_ID_1000006 =in= (1000452, 1000453) |
| Domain-level Survey answer | If the question has a client reference (clientRef): DOMAIN_QUESTION_REF_{questionRef} =in= ({questionRef}-{answerRef}) Example: DOMAIN_QUESTION_REF_INFRACOST > 5000 If the question has no client reference: DOMAIN_QUESTION_ID_{questionId} =in= ({questionId}-{answerId}) Example: DOMAIN_QUESTION_ID_1000006 =in= (1000452, 1000453) |
| Technologies | technologies =in= (JAVA, COBOL)
Available technologies: ABAP, ADA, APEX, ASPDOTNET, ASSEMBLY, CCPP, CICS, CLOJURE, COBOL, COFFEESCRIPT, COLDFUSION, CSHARP, DART, DB2, DELPHI, ERLANG, FORTRAN, FS, GO, GROOVY, IMSDB, IMSDC, JAVA, JCL, JS, JSP, KOTLIN, KSH, LISP, LUA, MARIADB, MATLAB, MYSQL, NATURAL, NSDK, OBJCCPP, PERL, PHP, PL1, PLSQL, POSTGRES, POWERBUILDER, PYTHON, R, REXX, RUBY, RUST, SCALA, SMALLTALK, SWIFT, TSQL, TYPESCRIPT, VB. |
| Segments | Segment:Cloud5R =in= (Cloud5R_Seg2, Cloud5R_Seg1)
You can use result of other segmentations in a formula. However, you cannot use a segment which is defined in the current segmentation (cyclic dependency). |
| Keyword Scan | Keyword:{KeygroupGroup}:{KeywordGroupItem}:{KeywordElement}.
Possible Keyword elements:
E.g., (Keyword:GDPR:People:occurrences > 0) OR (Keyword:GDPR:density < 0.3) OR (Keyword:GDPR:match == true OR Keyword:GDPR:People:match == false) |
| App Data Details | E.g.,
appData >= '{\"name\": \"JDK\", \"version\":\"17\"}'
You can use content of App Data Details (AppDataDetails.csv), which contains application environment insights such as the detected JDK or .NET versions. List of supported insights:
|
Formula operators
To configure your custom segments and define how their criteria (matchingRules elements) will be evaluated, you can combine CAST Highlight metrics above in a formula by using the following operators:
| Operator | Example |
|---|---|
| and | BI > 0 and BI < 50 |
| or | Health > 50 or OSS < 30 |
| =is= null | FTE =is= null |
| =is= notnull | OSS =is= notnull |
| > | OSS_license > 90 |
| < | CloudRoadblock < 500 |
| >= | CloudSurvey >= 80 |
| <= | CloudScan <= 80 |
| ( ) | BI > 50 and (CloudSurvey =is= notnull or CloudScan > 50) |
| =in= | QUESTION_REF_CAST_MAINT_DEVSKILL =in= (CAST_MAINT_DEVSKILL:LESS2MONTH,CAST_MAINT_DEVSKILL:6MONTH,CAST_MAINT_DEVSKILL:1YEAR) |
| =out= | QUESTION_REF_CAST_MAINT_DEVSKILL =out= (CAST_MAINT_DEVSKILL:LESS2MONTH,CAST_MAINT_DEVSKILL:6MONTH,CAST_MAINT_DEVSKILL:1YEAR) |
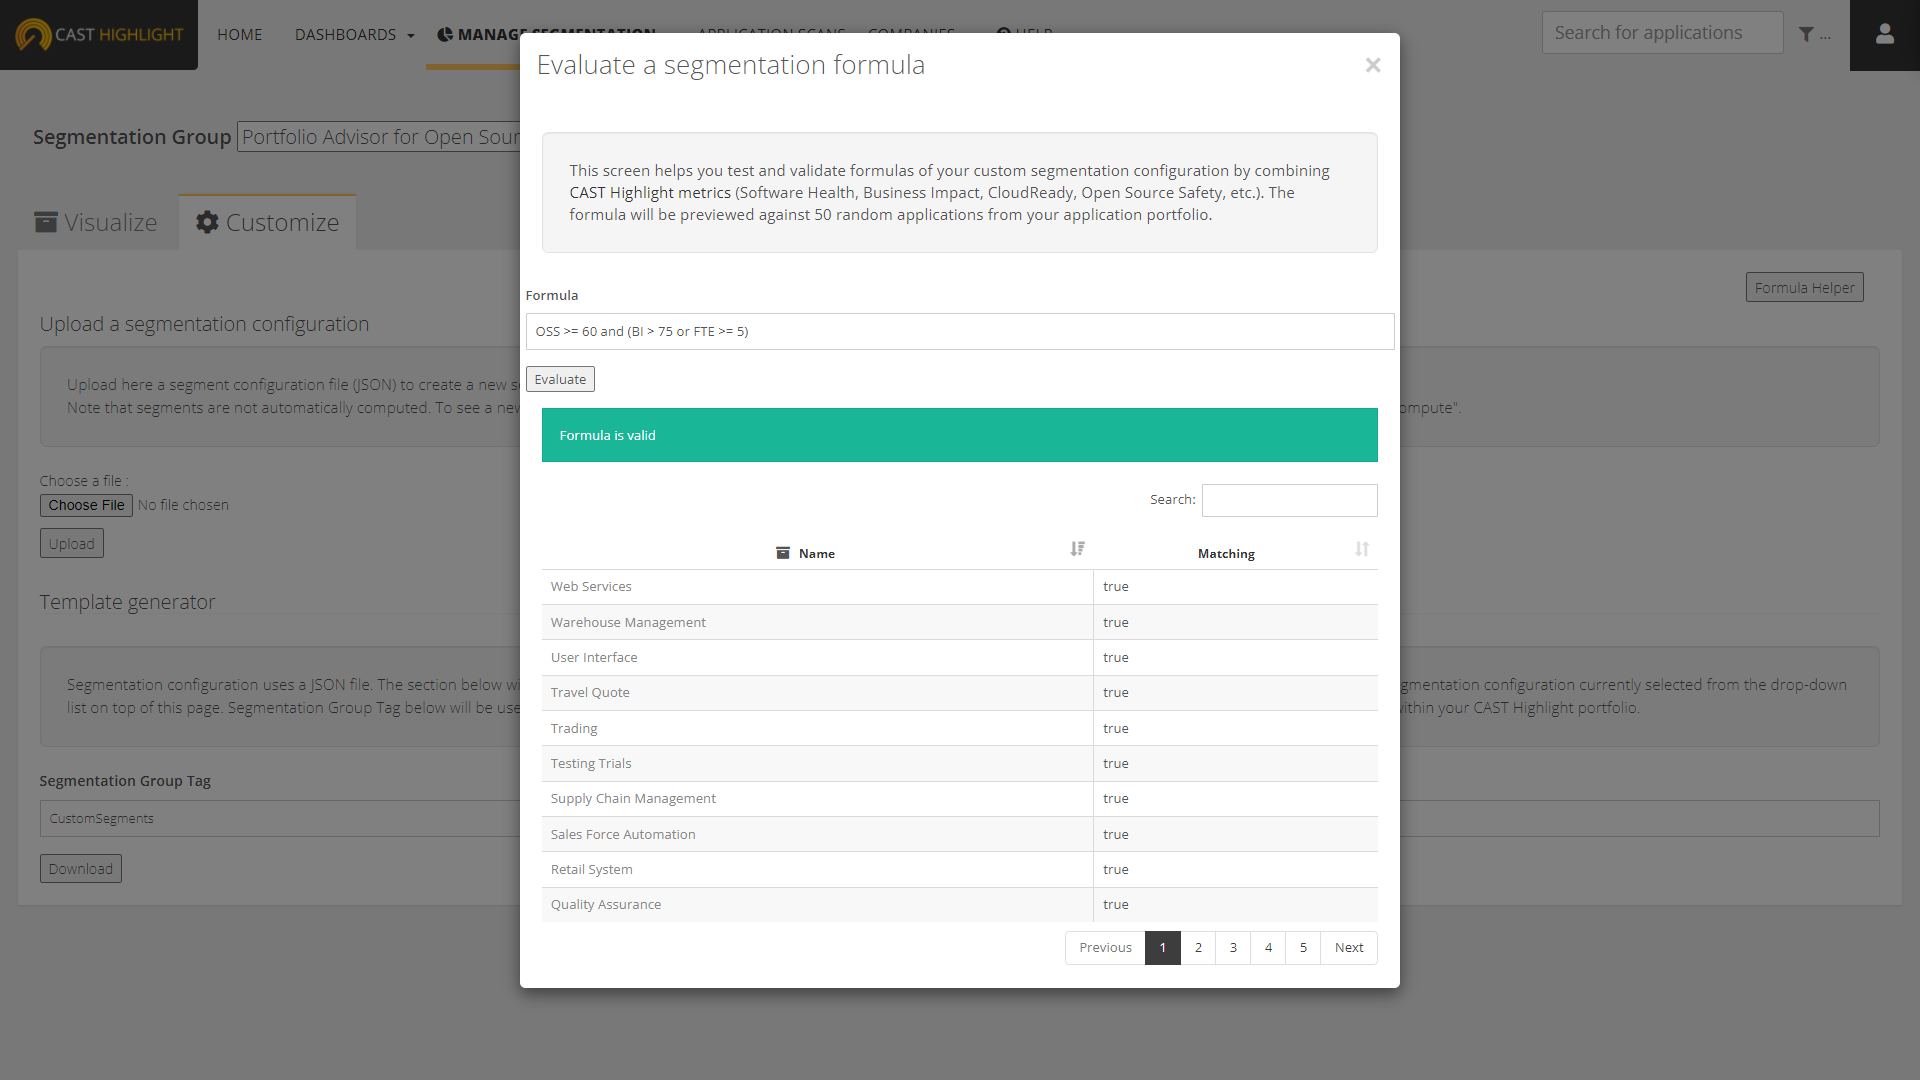
Prior to uploading your segmentation configuration to the platform, we recommend you to use the Formula Helper which can be opened by clicking on the button on top right of the “Customize” tab. Type the formula of the matchingRules you want to apply to a segment by combining metric identifiers and operators together, then click on “Evaluate”. The result indicates whether the formula is valid or not and provides a preview of applications meeting/not meeting the matching rules.
Draft vs. Production Configuration
Segmentation is not an exact science, hence the need to test and visualize results prior to deploying your segmentation configuration to users of your organization. Two statuses are possible:
- draft: this status will allow only Portfolio Managers to preview segmentation dashboards
- production: this status will display segmentation dashboards for all users
As you can imagine, we recommend uploading your initial segmentation configuration JSON files in draft status to validate them, then re-upload them in production status once the segments, metrics and formulas are stable.
Enjoy your Custom Segmentation dashboard!
Once segmentation configurations are published, Custom Segmentation dashboards have the same capabilities as CAST’s Portfolio Advisors for Cloud and Open Source.
All you have to do is to click on the “Compute” button as soon as you want to visualize segments for your existing application portfolio, or to refresh this segmentation with new application results.
Portfolio Visualization: The output is a unique dashboard where you can quickly view the relative size of each custom segment. The parliament chart on the left displays the portfolio distribution for each segment. Clicking on a specific segment will drill down, automatically filtering the bubble chart on the right to the applications recommended for the selected segment, enabling further prioritization.
Case-by-case app segmentation: Since the custom segmentation model makes recommendations, a Portfolio Manager can manually change the segment of an application. These changes are maintained by clicking on the “Save” button. At any time, users can roll-back to the original CAST-calculated recommended segments.
Export: from the Portfolio Advisor view, click on the “Export” button to generate an Excel report listing all applications with their corresponding segment recommendations and key metrics used for the segmentation.