The Power is Yours: Custom Indicators
When contextual insights meet scientific metrics
Whether you are leading an IT Rationalization, IT Modernization or Cloud Migration initiative, your baseline should always stay grounded in facts. If not, it’s easy to get trapped in the endless loop of “wrong data leads to wrong decisions“.
To aid in the decision making process, you may want to target applications to:
- Retire because no longer part of the business & it roadmap
- Reprioritize because the overall risk may lead to a loss of revenue
- Rehost because despite the business value, the infrastructure SLA is too demanding and therefore too expensive
- Refactor to optimize customer value thanks to intelligent cloud workloards
- …

How to configure custom indicators
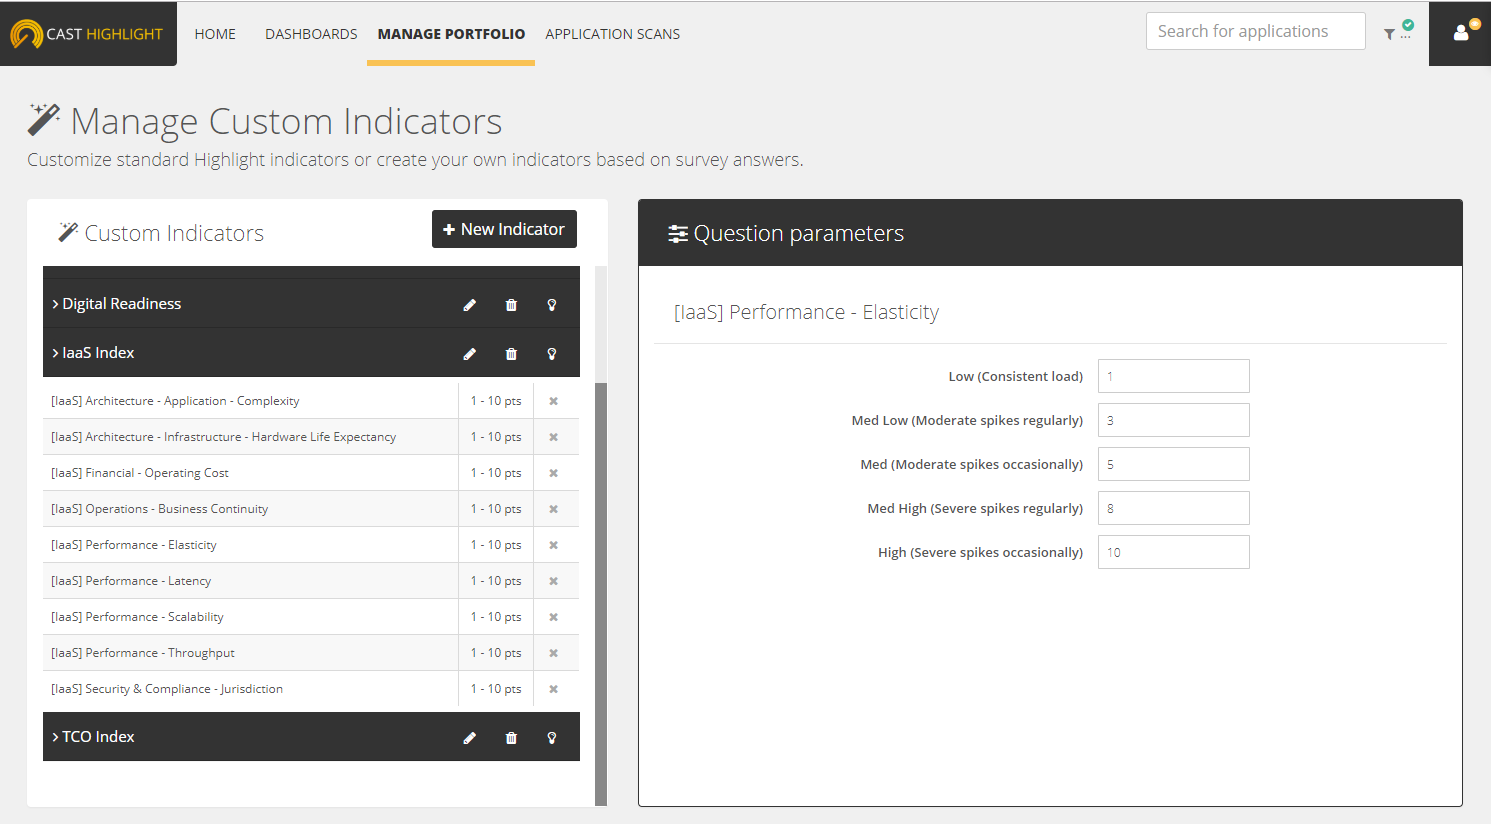
First, to keep overall consistency & governance, only root-level portoflio managers can be granted access to “Manage Custom Indicators” which is part of the “Manage Portfolio Menu”. From this page, you can customize an existing indicator or create a brand new one.
In case you want to modify the way to compute standard indicators such as Business Impact or Cloud Maturity, you simply have to edit them and change the underlying questions and the associated weights to recompute their scores.
In case you want to create your new indicator, you have to use survey questions, which can be existing ones or newly created ones. From Manage Custom Indicators, you will apply specific weights to all the survey answers.
As you can see, the process is easy & fast – you can find more details into the associated Getting Started Guide.

The benefits of using Custom Indicators
As mentioned previously, it’s important to position custom indicators as an additional layer on the top of the application portfolio analysis metrics driven by the code analysis. Because they are easy to create, configure & update, they can become extremely valuable to collect tactical or strategic information to support your enterprise initiatives.
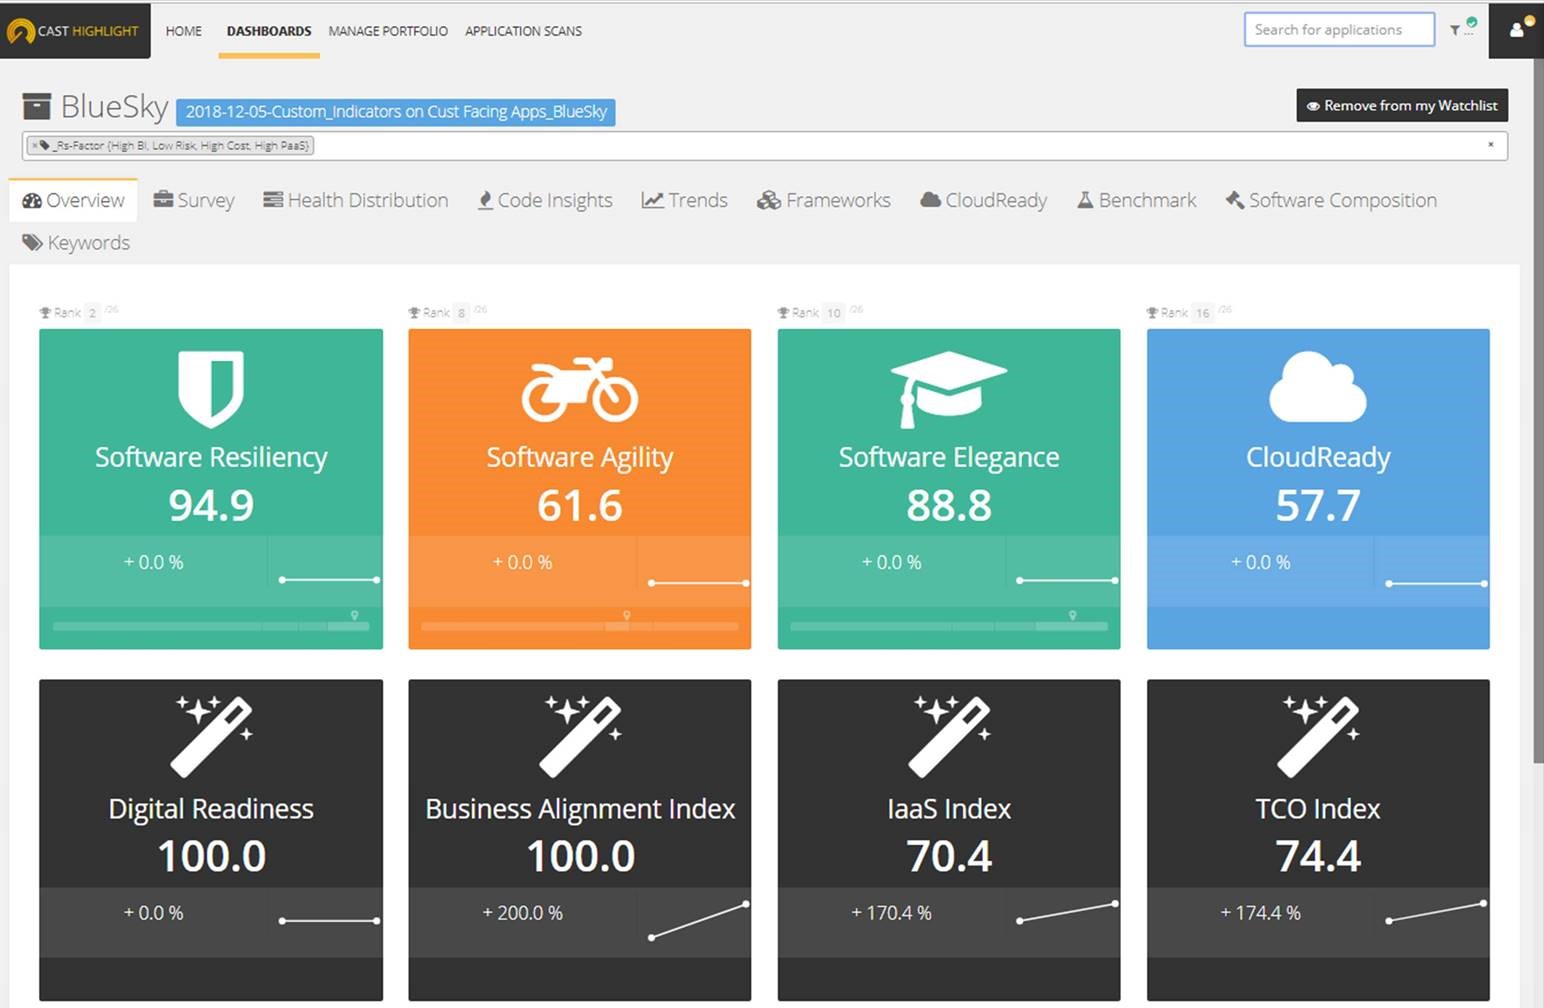
Bear in mind that the value of these Custom Indicators is also meant to evolve over time, which can be monitored at both the portoflio & application levels.
Below, you’ll find an applicaiton ID card displaying the evolution of the metrics over the last few assessments:

Leverage a multi-dimensional analysis
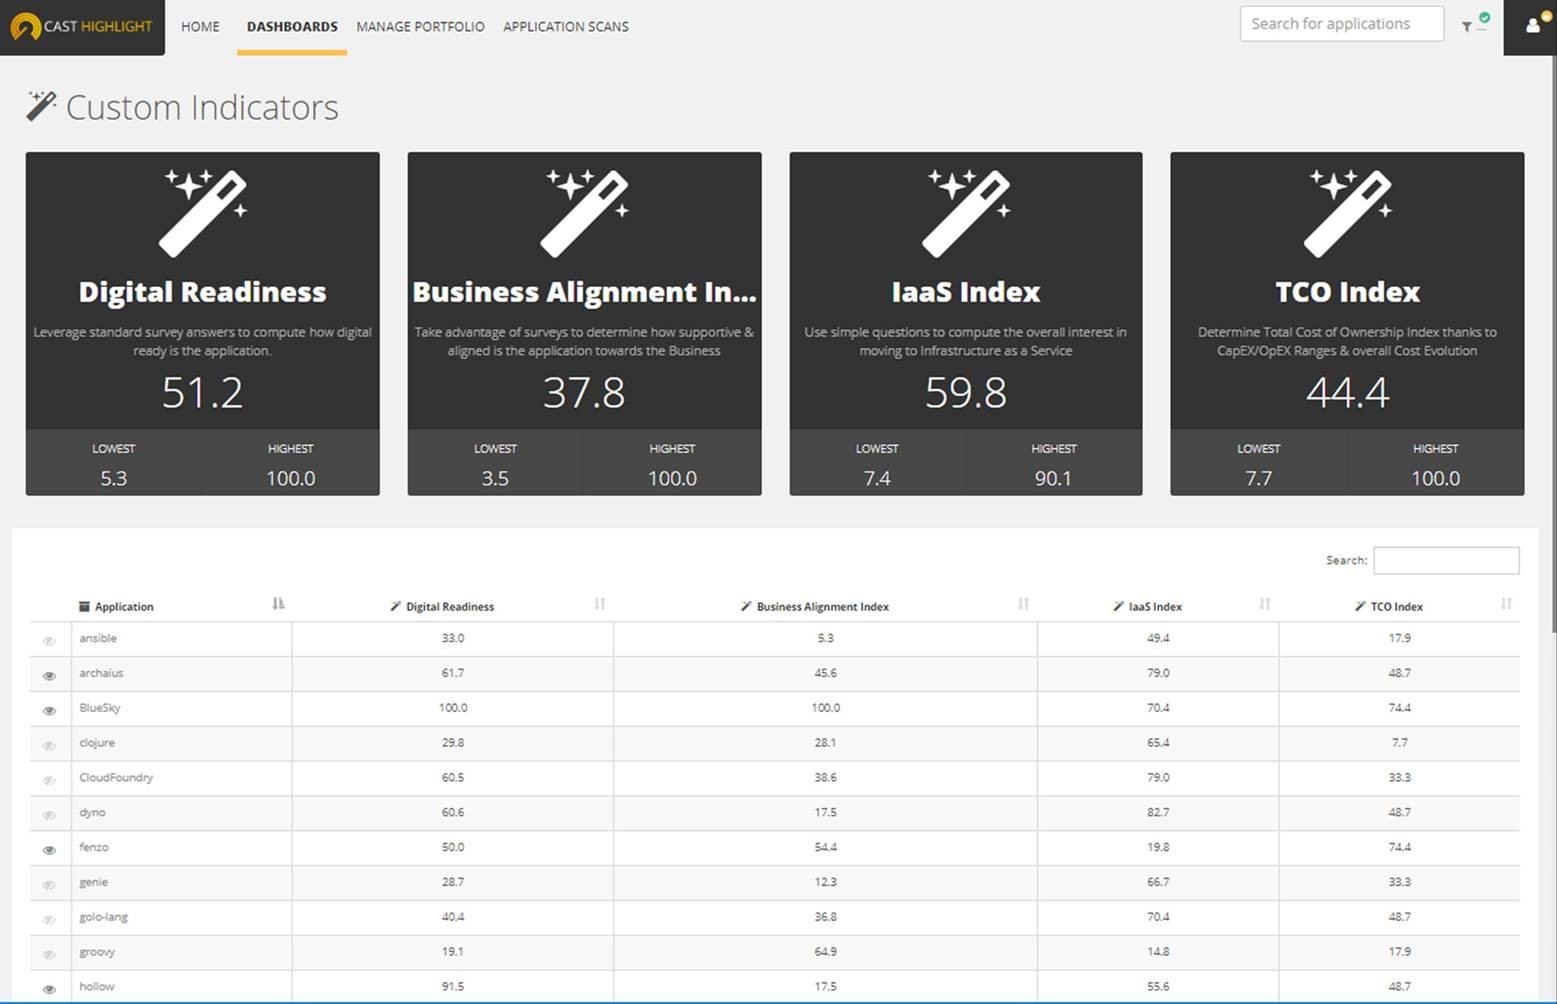
- CAST Highlight supports these news custom indicators as an entire dimension, meaning you can get a consolidated view at the portfolio level and a single view at the application level.
- Even more importantly, you can leverage these new analysis angles from the Application Results table. In other words, you can apply your own segmentation rules using both the standard foundation metrics and your own custom indicators. (associated resource: How to segment your portfolio and export – 2 min Tutorial).

Integrate your methodology
- As a Customer, Partner or even as an Independant Consultant, you may want to integrate your expertise and experience into CAST Highlight. You can decide to edit, remove, create existing & new indicators to adapt the solutions to your reality. Because it stays agile, you can even decide to make it evolve over time by changing the survey questions and/or the formulas to compute the scores.
- For those who are leveraging an integrated approach with third party tools, these indicators are also made available through our fully documented REST API.
We sincerely hope this blog post shows the great value of custom indicators. To learn more about the underlying concepts and configuration, check out the Custom Indicators Getting Started Guide. We can’t wait to hear your ideas, suggestions & comments about this new feature. The CAST Highlight team is at your disposal for any further information – do not hesitate to reach out to us via these contact details

