Helping in the journey to save the planet
A small action alone has little effect, but if millions of people do this same small action, the impact will be significant. This was our approach when designing the new Green Impact insights in CAST Highlight. As Software Intelligence experts, we know code, how to understand it programmatically (parsing), and how to consolidate and convey insights to users. As citizens of Earth, we want to make a humble contribution to raise awareness of software’s impact on global warming and how Software Intelligence can help users improve efficiency of their software. This is the essence of the new Green Impact insights.
In a nutshell, the Green Impact score combines code scan insights and survey questions related to the application context to calculate a score from 0 to 100, higher being better (for the planet).
However, it’s critical to understand that it’s not really about focusing on the numeric score itself, but rather the opportunity to improve your software’s Green Impact on a continuous basis.
Below are the various elements of the calculation.
Green Impact score calculation
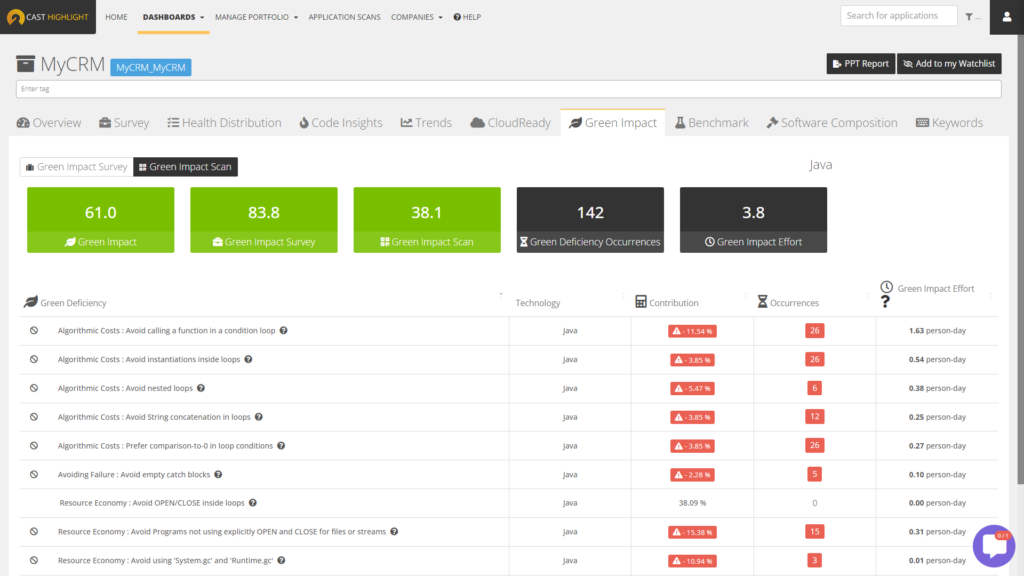
- Green Impact score: At the application level, the Green Impact score is the average between the Green Scan score and Green Survey score.Example: an application has 87/100 for the Green Scan score and 43 for the Green Survey score. The Green Impact score will be 65/100.
- Green Scan score:
- At the application level, the Green Scan score is the average of Green Scan scores of evaluated technologies (see the list of supported programming languages for Green Impact).Example: the C# scan has 94/100 and the JavaScript scan has 23/100. The Green Scan score will be 58.5/100.
- At the technology level, the Green Scan score is calculated by a weighted average of the detected Green Deficiency patterns, the number of occurrences and the number of lines of code for a given technology. The Green Deficiency pattern weights can be different from one technology to another. The list of Green Deficiency patterns available in CAST Highlight is based on a subset of CAST Imaging rules for Green and derived from standards such as PCI, MITRE’s CWE, OMG’s CISQ, etc.
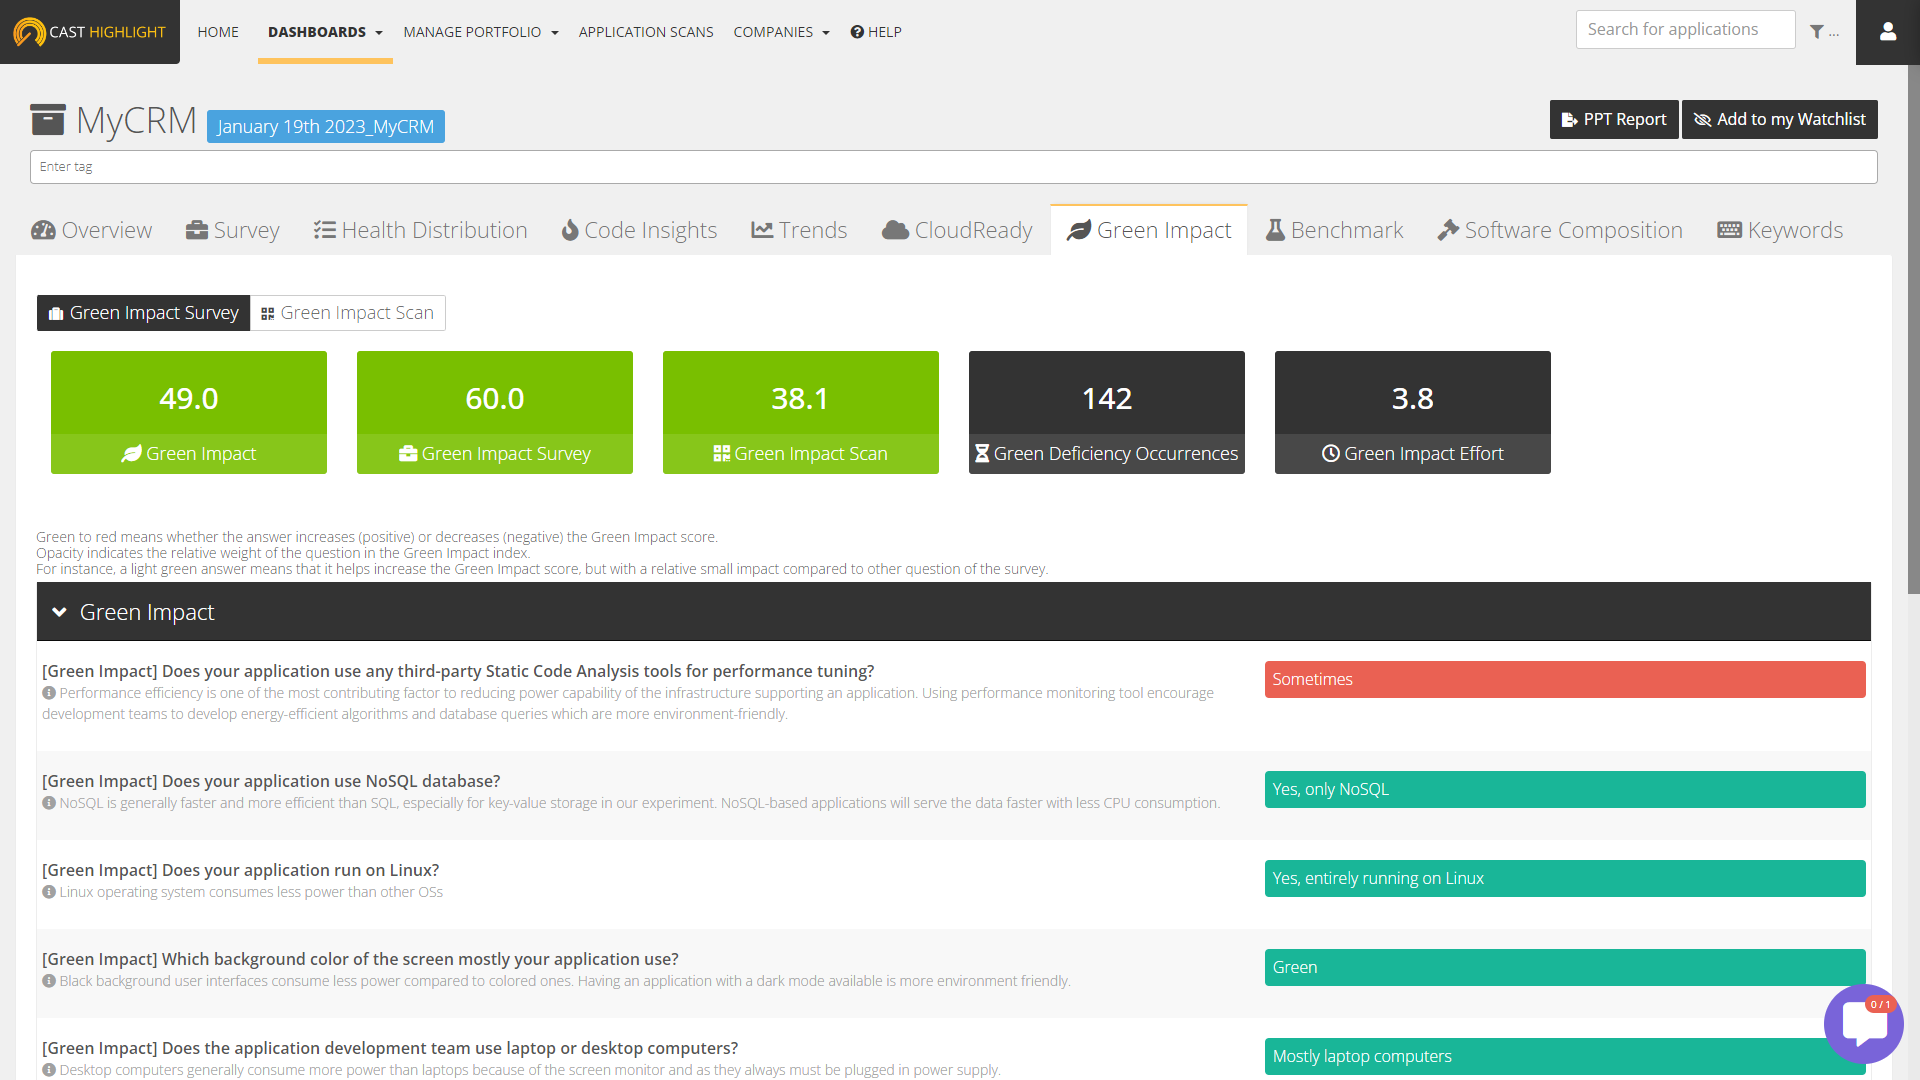
- Green Survey score: At the application level, the Green Survey score is a normalized score from 0 to 100 depending on the Green Impact survey answers. Each survey answer has a specific weight that increases the score. The list of survey questions is available from the Indicator & Methodology deck.
CO2 Emission Estimator (beta)
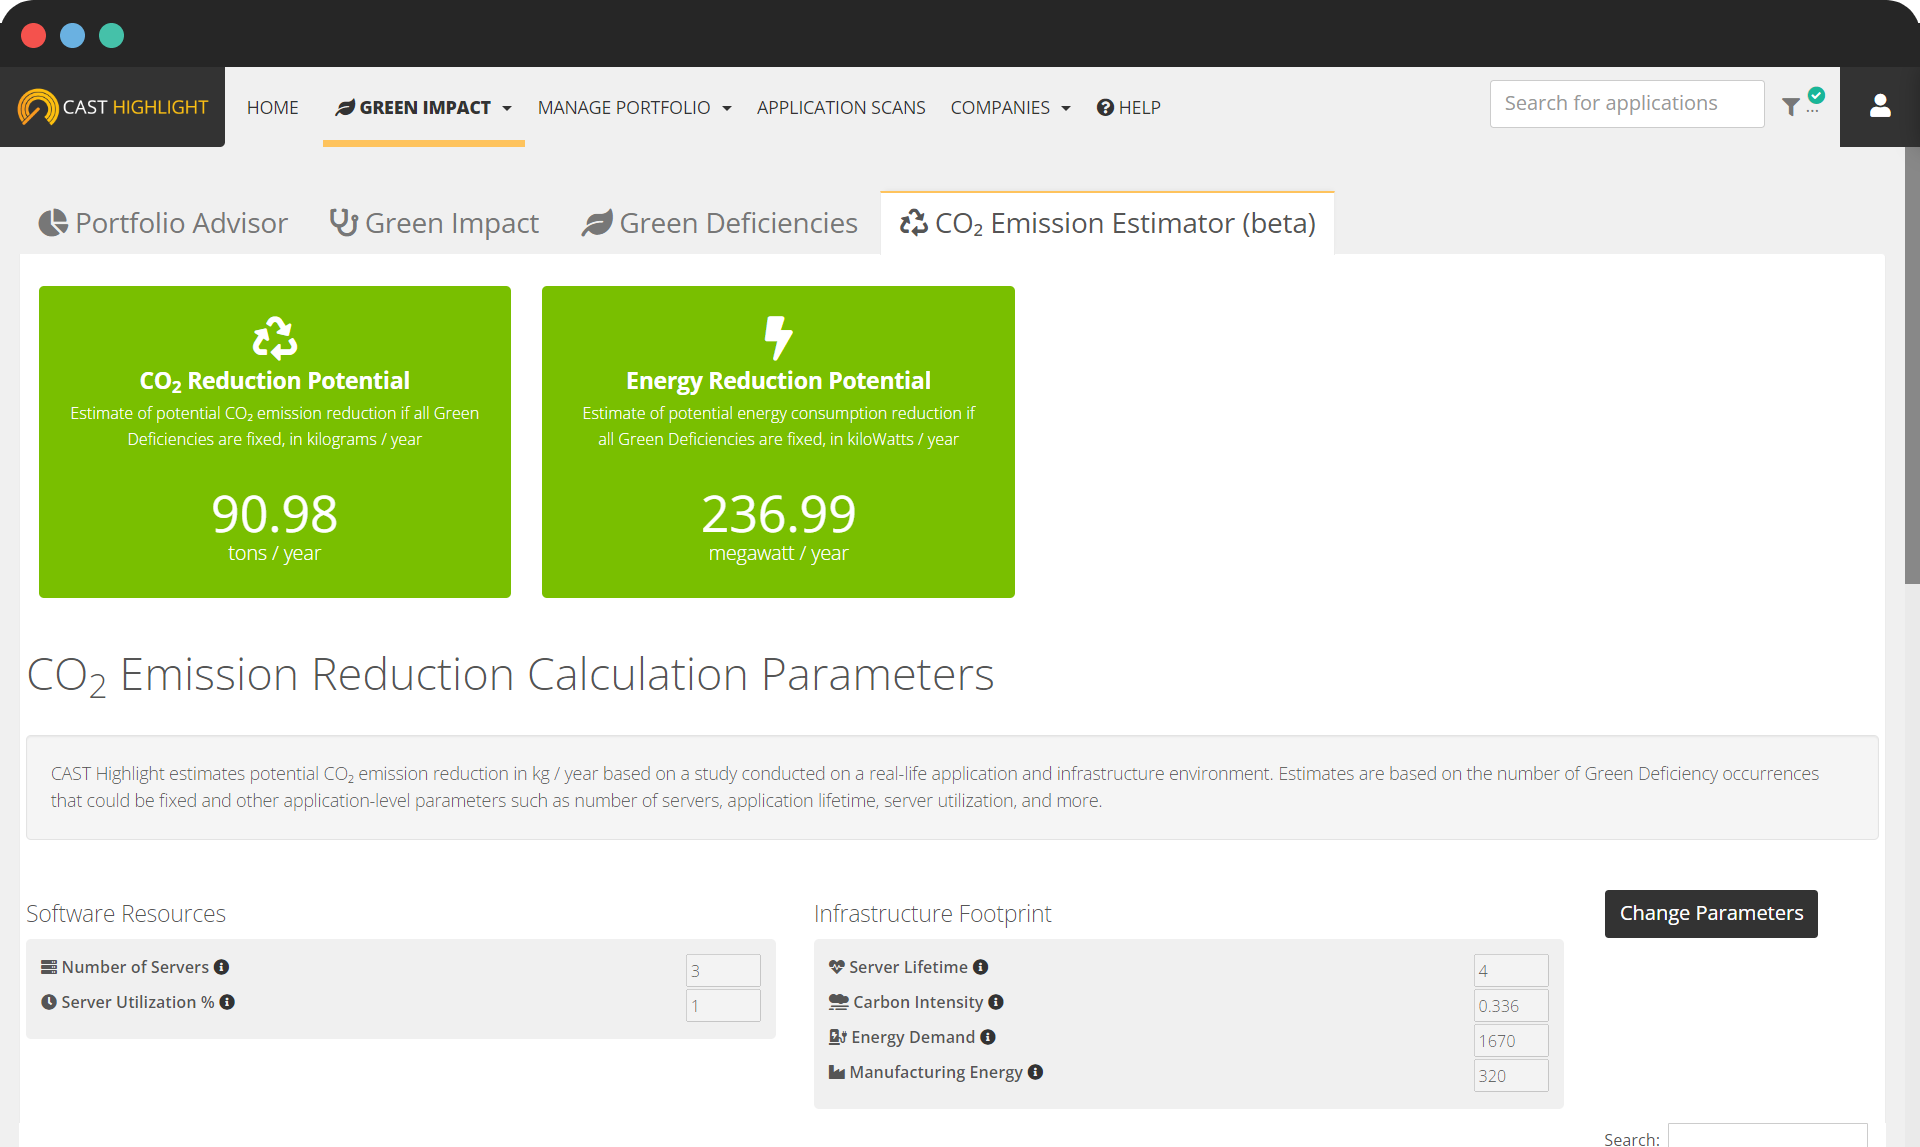
Get more tangible and actionable Green Software Insights including estimates on the potential reduction in CO2 emissions and energy consumption if Green Deficiencies are fixed across an application portfolio. In this beta version, calculations are based on a combination of automatically generated insights and user-configurable parameters such as the number of servers, server utilization, energy demand, and more.
- CO2 Reduction Potential: Estimate of potential CO₂ emission reduction if all Green Deficiencies are fixed, in kilograms / year.
- Energy Reduction Potential: Estimate of potential energy consumption reduction if all Green Deficiencies are fixed, in kiloWatts / year
For more details on the CO2 Emission Simulator feature and calculation, you can download this deck.