
Feature Focus: Extending Software Intelligence insights by leveraging the Custom Dashboards feature
How to create your first custom dashboard
Custom dashboards can be created by any user. Depending on your user role, your custom dashboard will be visible to you only or to other users. From the menu, go to Dashboards > Custom Dashboard and click on the ‘+’ icon.
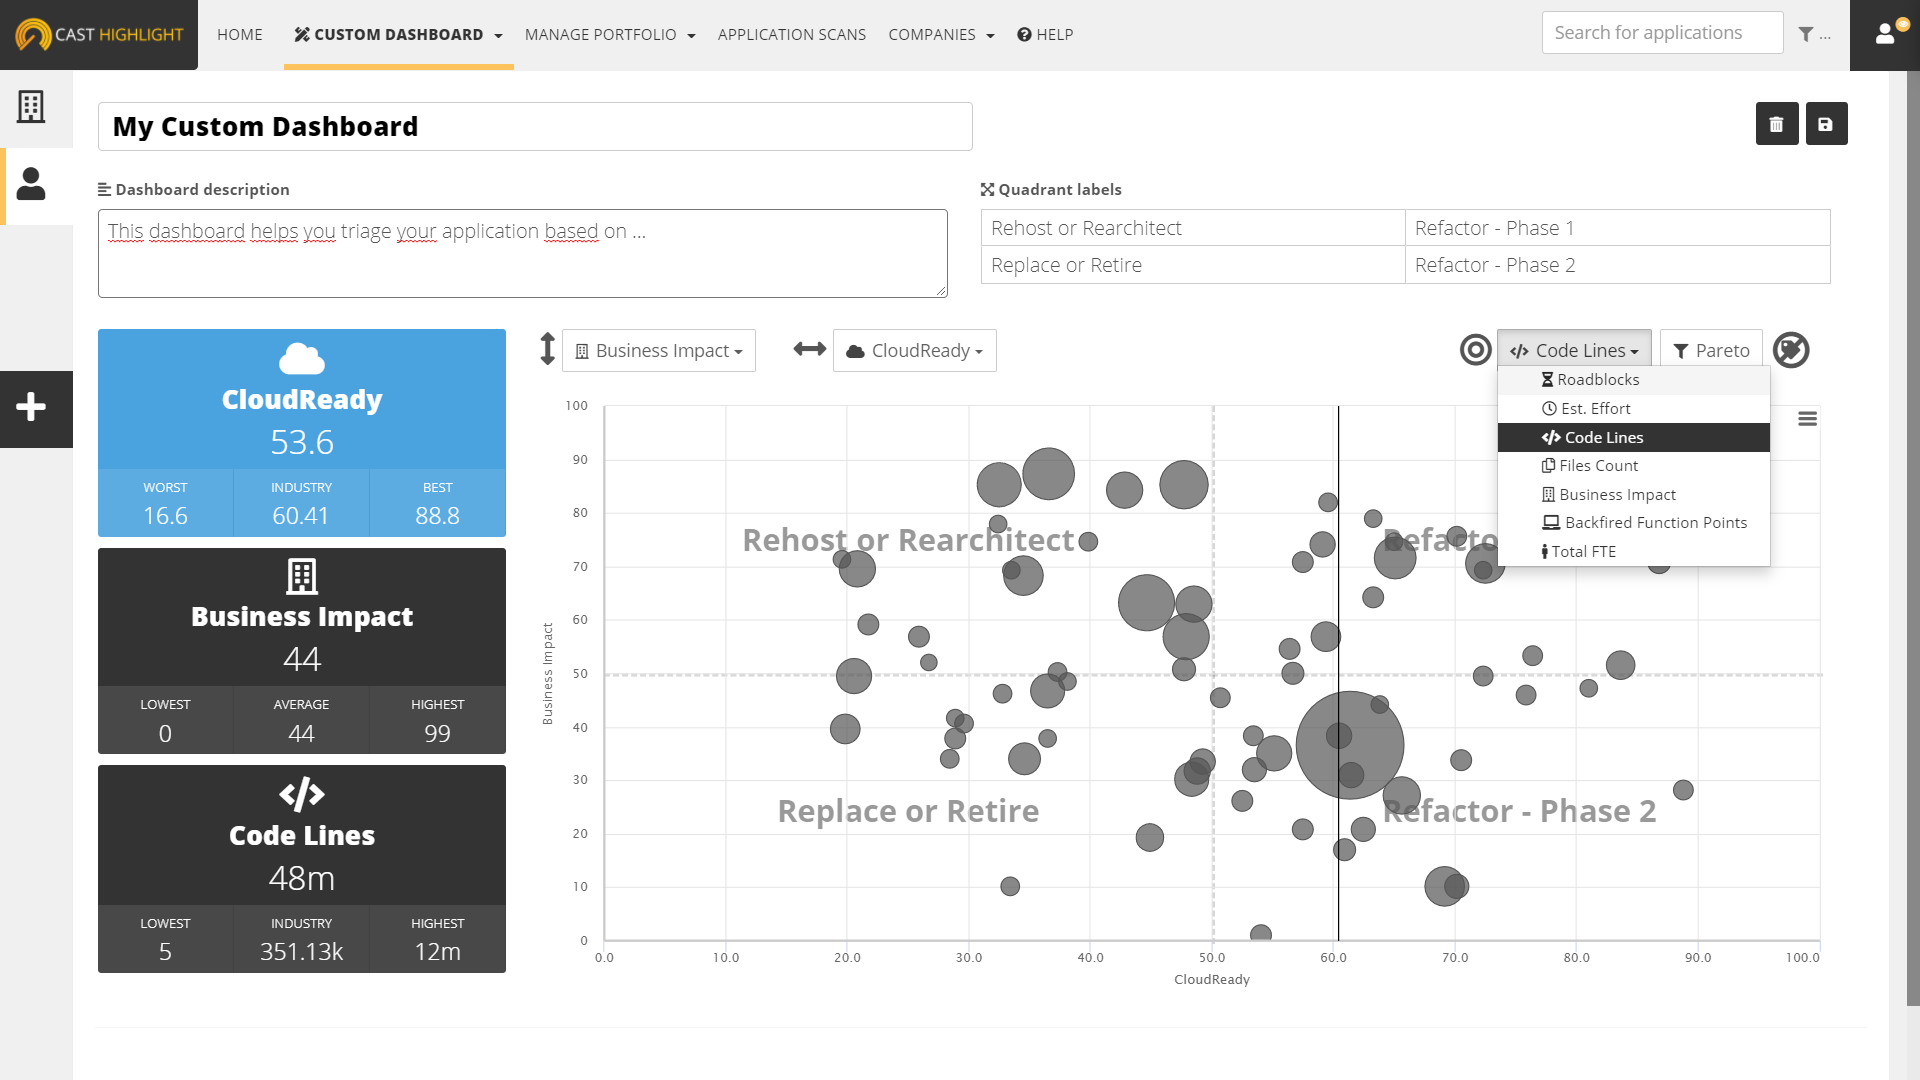
As you switch from an indicator to another, the bubble chart is instantly updated to view the change.
Finally – probably the most exciting and important step to ensure that your custom dashboard will provide meaningful insights for other users – you can also define labels for each of the four quadrants that correspond to a possible decision when an application falls in this bucket.
Once you’re done with all the elements of the custom dashboard you’re ready to show your favorite CIO to let him/her know which apps to retire or move to the Cloud, don’t forget to save it by clicking on the disk icon. 😉
List of available widgets in custom dashboards
Most of CAST Highlight metrics and indicators can be used in custom dashboards. In addition, any custom indicator you create would be available as well. See below the list of widgets you can use.
- Metric tile: display the aggregated score of the selected metric (e.g., Open Source Safety)
- Description panel: add a text explanation to any other widget
- Application Results table: a data table with a list of applications with selected metrics
- Bubble Chart: an application bubble chart with selected metric axes and quadrants
- Column Chart: a column chart counting applications grouped by selected metric and score range
- Milestone: add a selected milestone from the Continuous Improvement Tracker feature
- Quick Portfolio Insights
- Vulnerabilities: a count and details on CVEs for selected criticality levels (e.g., Critical, KEVs, Advisories, etc.)
- Licenses: a count of license occurrences across applications for selected license risk levels (e.g., High, Medium, etc.)
- Trends: a trend chart of the selected metric
- Software Health
- Software Resiliency
- Software Agility
- Software Elegance
- Open Source Safety
- Cloud Maturity index
- Cloud Survey index
- Cloud Code Scan index
- Cloud Boosters
- Cloud Blockers
- Roadblocks (number of Cloud blocker occurrences)
- Cloud Maturity Estimated Effort
- Business Impact
- ROAR Index
- Backfired Function Points
- Code Lines
- File Count
- Recommended Maintenance Effort
- Recorded Maintenance Effort
- Total FTEs
- Technical Debt
- Technical Debt Per LOC
- Custom Indicators