
Feature Focus: Cloud Maturity Effort Estimate
Not all Cloud blockers are equal
When it comes to fixing things in your application that could slow down a migration to the Cloud, not all blockers are equal. While you may have many small things which could be easily fixed (e.g. replace a hardcoded IP address by a hostname), some other roadblocks are much more complex as they impact the different layers of an application (i.e. code, framework, architecture) and require more effort to fix.
Additionally, for the same blocker pattern found in source code, the solution and/or the required effort to remediate it can be significantly different depending on the technology. This is why it is important to not only look at the number of occurrences of a Cloud blocker, but also the required effort to remove the blocker occurrences. The result is a better approach to estimate, prioritize and plan the effective migration tasks.
This is the purpose of the metric we introduced in CAST Highlight’s June release: the Cloud Maturity Effort estimate.
How to use Cloud Maturity Effort estimates for planning
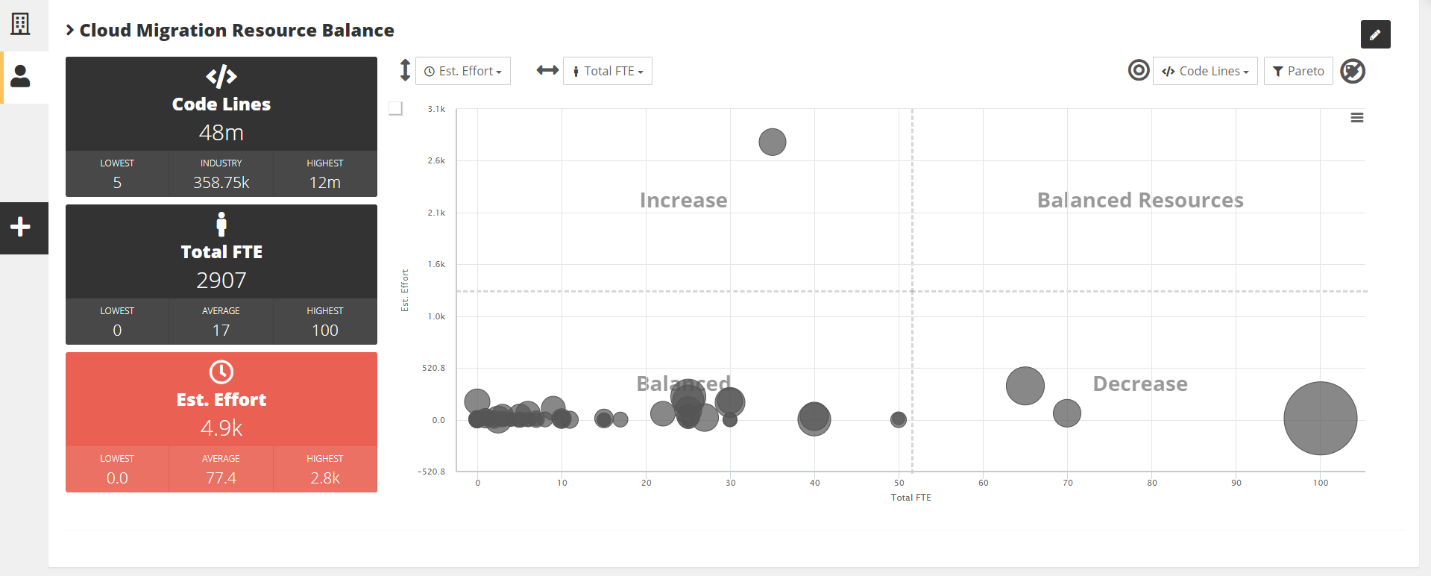
In addition to Cloud Maturity scores, boosters and blockers, roadblocks, etc. you can now see the effort estimate that it would take to remove all occurrences of Cloud blockers in your application, expressed in man-days. The metric is available in the various dashboards where it makes sense: at the portfolio level in the Cloud Maturity matrix summarized by application, in Cloud Requirements summarized by blocker, and naturally at the application level with all the details. It is also available from custom dashboards where you can use it as vertical/horizontal axis or as the bubble size selector.
One concrete example of using this metric to better prioritize and optimize resource allocations for upcoming migrations could be, for instance, to distribute your application portfolio on Cloud Maturity Effort estimate as the vertical axis and FTEs (Full Time Equivalent) as the horizontal axis. This would quickly show which apps lack the necessary developer resources compared to the effort needed to fix cloud migration blockers, i.e. the applications in the upper left quadrant.
How Cloud Maturity Effort estimates are calculated?
The Cloud Maturity Effort estimate calculation is quite simple: CAST Highlight sums all triggered Cloud Maturity blocker occurrences (a.k.a. roadblocks) x the unit remediation effort (e.g., 2 hours to get rid of a COM component).
You have a different effort estimate number? Customize the model
The Cloud Maturity Effort estimate feature comes with an out-of-the-box template with pre-defined values provided by CAST consultants who are experts in cloud migration. However, when it comes to agreeing on a level of effort for remediating blockers in a custom application, views may differ by organization, team, technology stack, development methodology, etc. This is why CAST Highlight allows users to define their own estimate for each Cloud pattern. Let us see how it works.
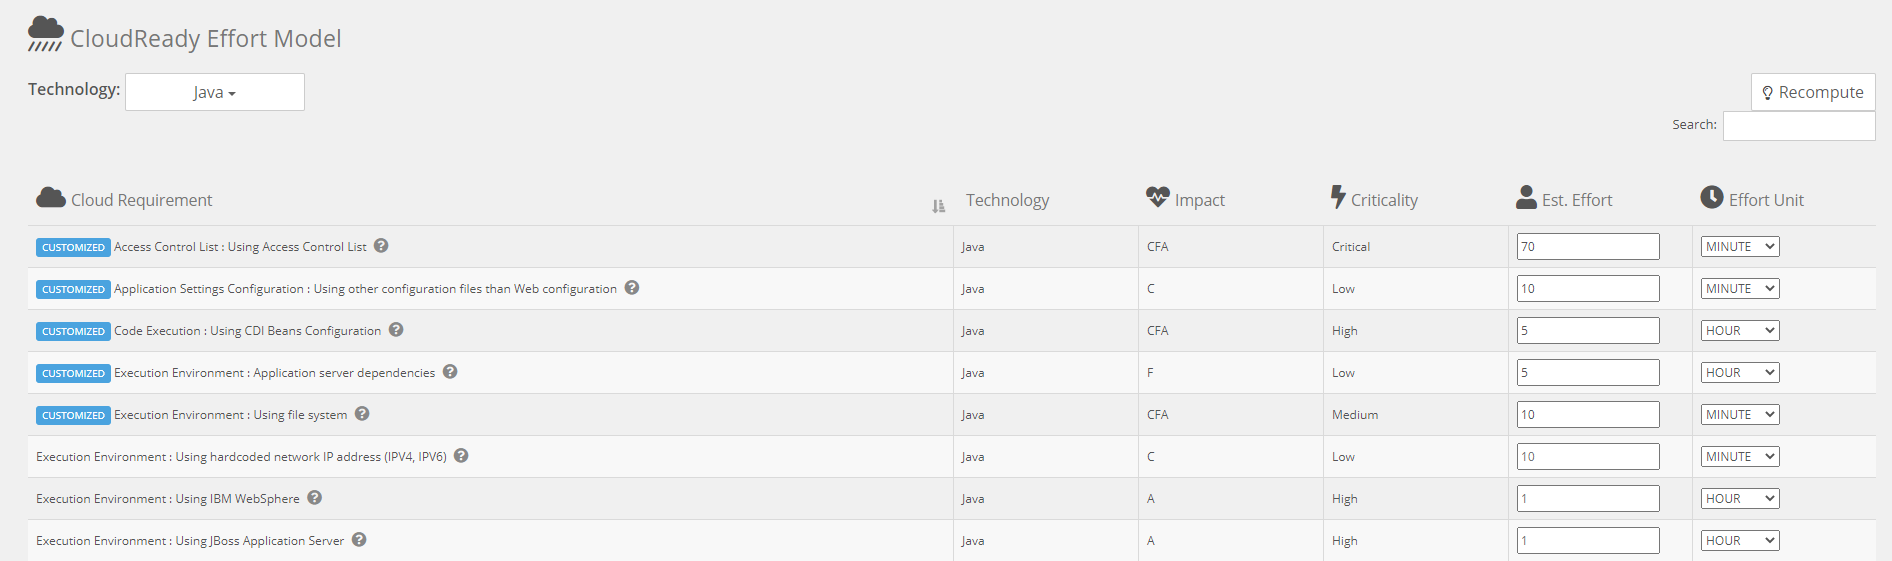
- You can see the list of all the Cloud blocker patterns and details (impact, criticality, etc.) with pre-defined effort values from CAST’s template
- You can filter and customize each technology profile separately (as some simple roadblocks in Java may be harder to tackle in COBOL and Python or vice-versa)
- Select the effort unit associated with the value you type (e.g. 10 minutes, 1 hour, 2 business days)
- Once you are done editing the Cloud Maturity Effort Estimate model, save it and re-compute values for applications that were previously there to refresh the effort metrics.
- A few minutes after, the new effort values are available for the different applications in your portfolio
- In some Excel and API exports, the Cloud Maturity Effort estimates are expressed in minutes. In the dashboards, the estimates are translated in person / days, with 8 hours per day
Here we go, you are now ready to assess your plans and priorities with another facet of the Software Intelligence prism.
However, this approach has inherent limitations: it does not currently account for contextual factors such as the potential for automated code fixes, reuse of remediation patterns across similar issues, variations in developer productivity, or the broader architectural impact of certain blockers. As a result, in some cases, the estimated effort may appear high or low from a user perspective relative to the application’s size or complexity. The metric should therefore be interpreted as an indicative effort baseline rather than a precise number for project planning.