Explore your OSS dependencies. Visually!
Looking for a needle in a haystack
A typical business application contains 200 to 300 open source components on average and each component has about 60 dependencies itself (read my recent post on Transitive Dependencies). Hence, evaluating risks may be perceived as easier than finding a needle in a haystack in the eyes of InfoSec teams.
Today, editing or reviewing a SBOM (Software Bill of Material) in a grid format is common – most of the time in an Excel sheet with a huge list of components including reported CVEs (common vulnerabilities and exposures) and possible risky licenses. Common but – coming from someone having done the exercise many times myself – it is painful, boring and not interactive at all.
When it comes to data visualization, it’s not only about being more productive so that you can review 10 SBOMs a day…it is also – and almost only – a way to consume the data by enjoying what you’re looking at, in order to make you go the last mile with ease:
- Identify the hidden CVEs in a 3-level deep malicious Node module that can put your entire application at risk;
- Isolate license compatibility issues in the chain of dependencies;
- Provide your development team with factual and accurate data to upgrade the right component which will reduce technology obsolescence of deprecated or non-mature (alpha, beta…) dependencies; and
- Educate product teams about proper and systematic dependency management over reckless introduction of GitHub repos in the codebase.
Think of all that risk you can identify and mitigate simply because you enjoy looking at your data more. This is the reason why we wanted to let you visualize dependencies of your software in a more visually appealing manner.
How to use the OSS Dependency Explorer
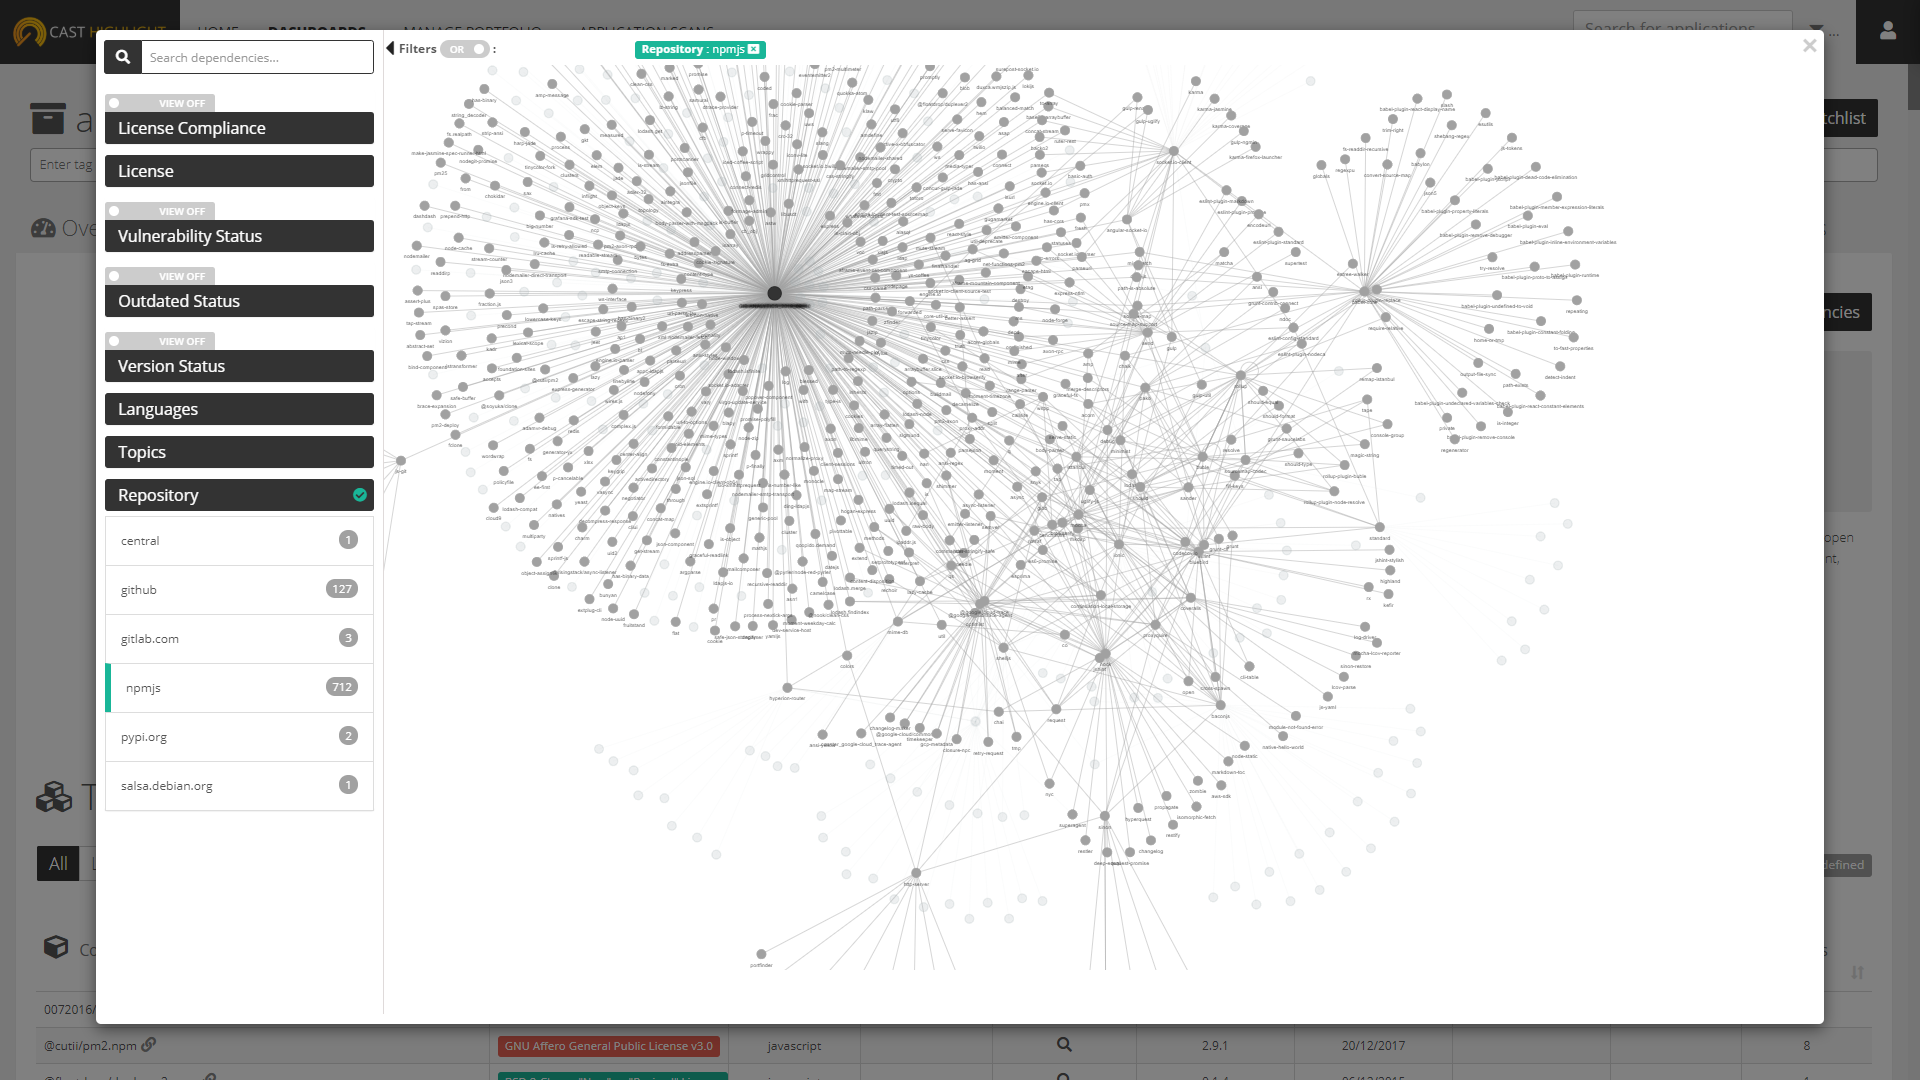
By default, clicking on the “Explore Dependencies” button will open a neural network chart with your application as the central node and all its level-1 dependencies. Clicking on a component will expand it with its own dependencies (level 2). Clicking on level-2 components will expand to level 3 and so on. At this point, you’ll quickly see that Open Source is sometimes a small world, with a lot of components linked together, something very difficult to envision in a “flat” SBOM. Most popular projects often rely on each other, making your app dependency graph look like a spider web.
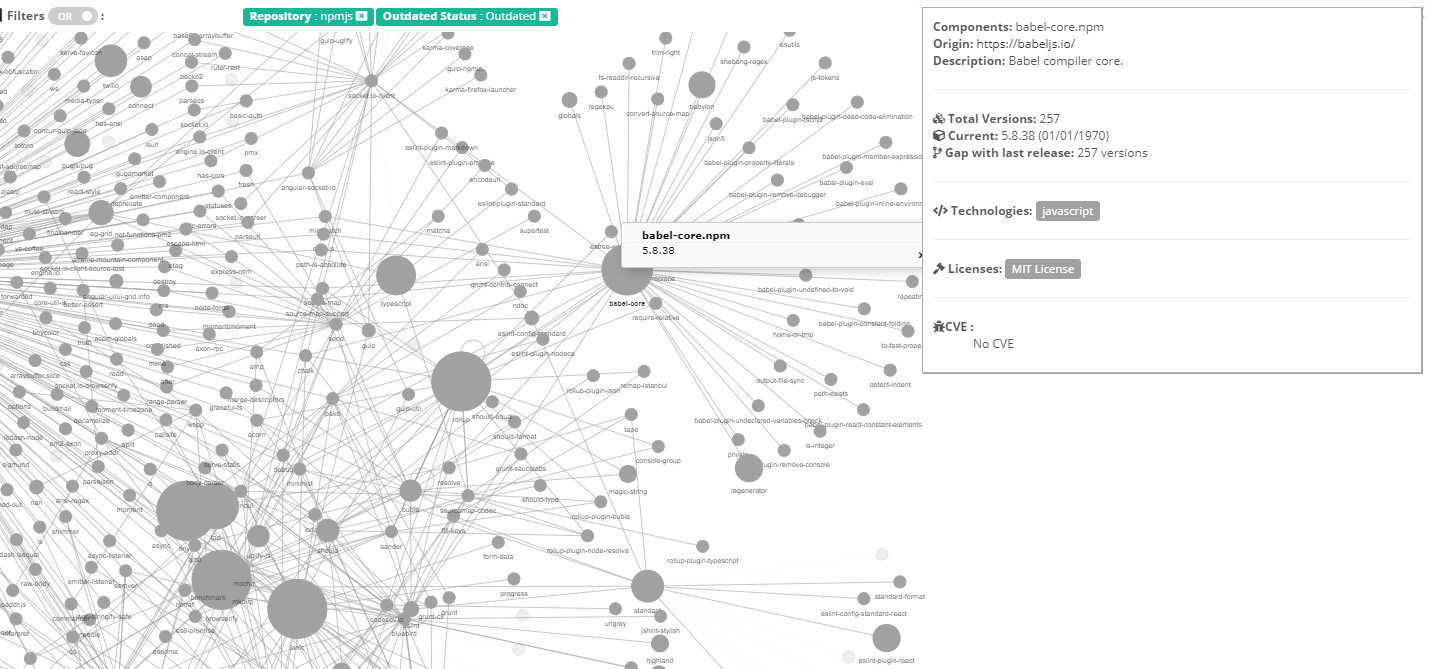
You can hover over a node to retrieve a component’s meta information such as the version pulled by your application, the license(s), possible vulnerabilities, etc. But, that’s a lot of data to digest, right? Let’s see how to use Views and Filters in Highlight to make this complex spider web look crystal clear.
Views vs. Filters
In the OSS Dependency Explorer, activating a View enhances the data by changing color and size of nodes. Four different Views are currently available in Highlight’s OSS Dependency Explorer:
- License Compliance: this view will color components according to the license risk profile defined for your portfolio.
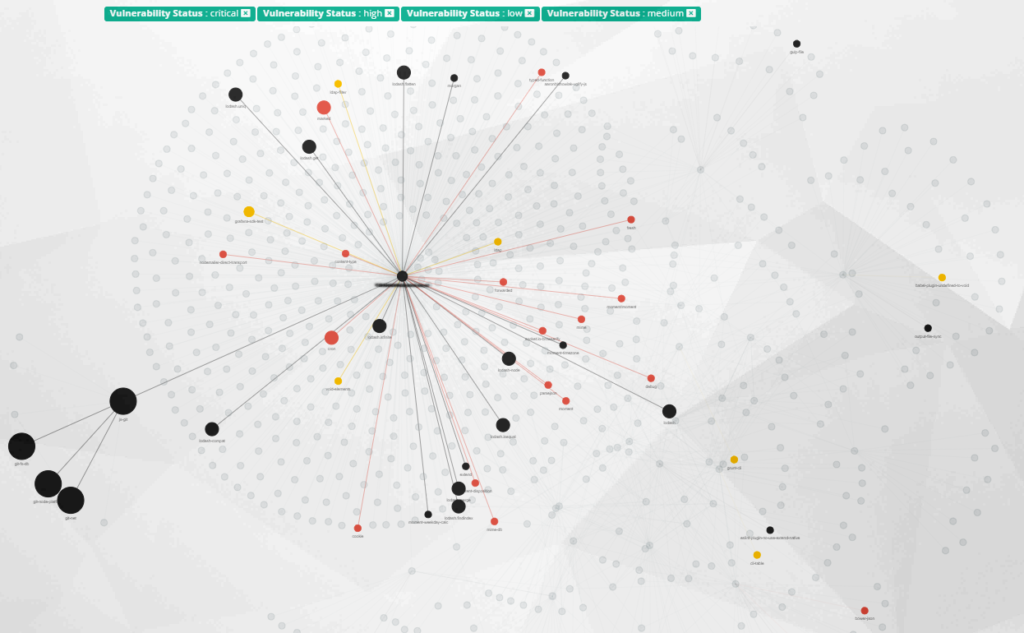
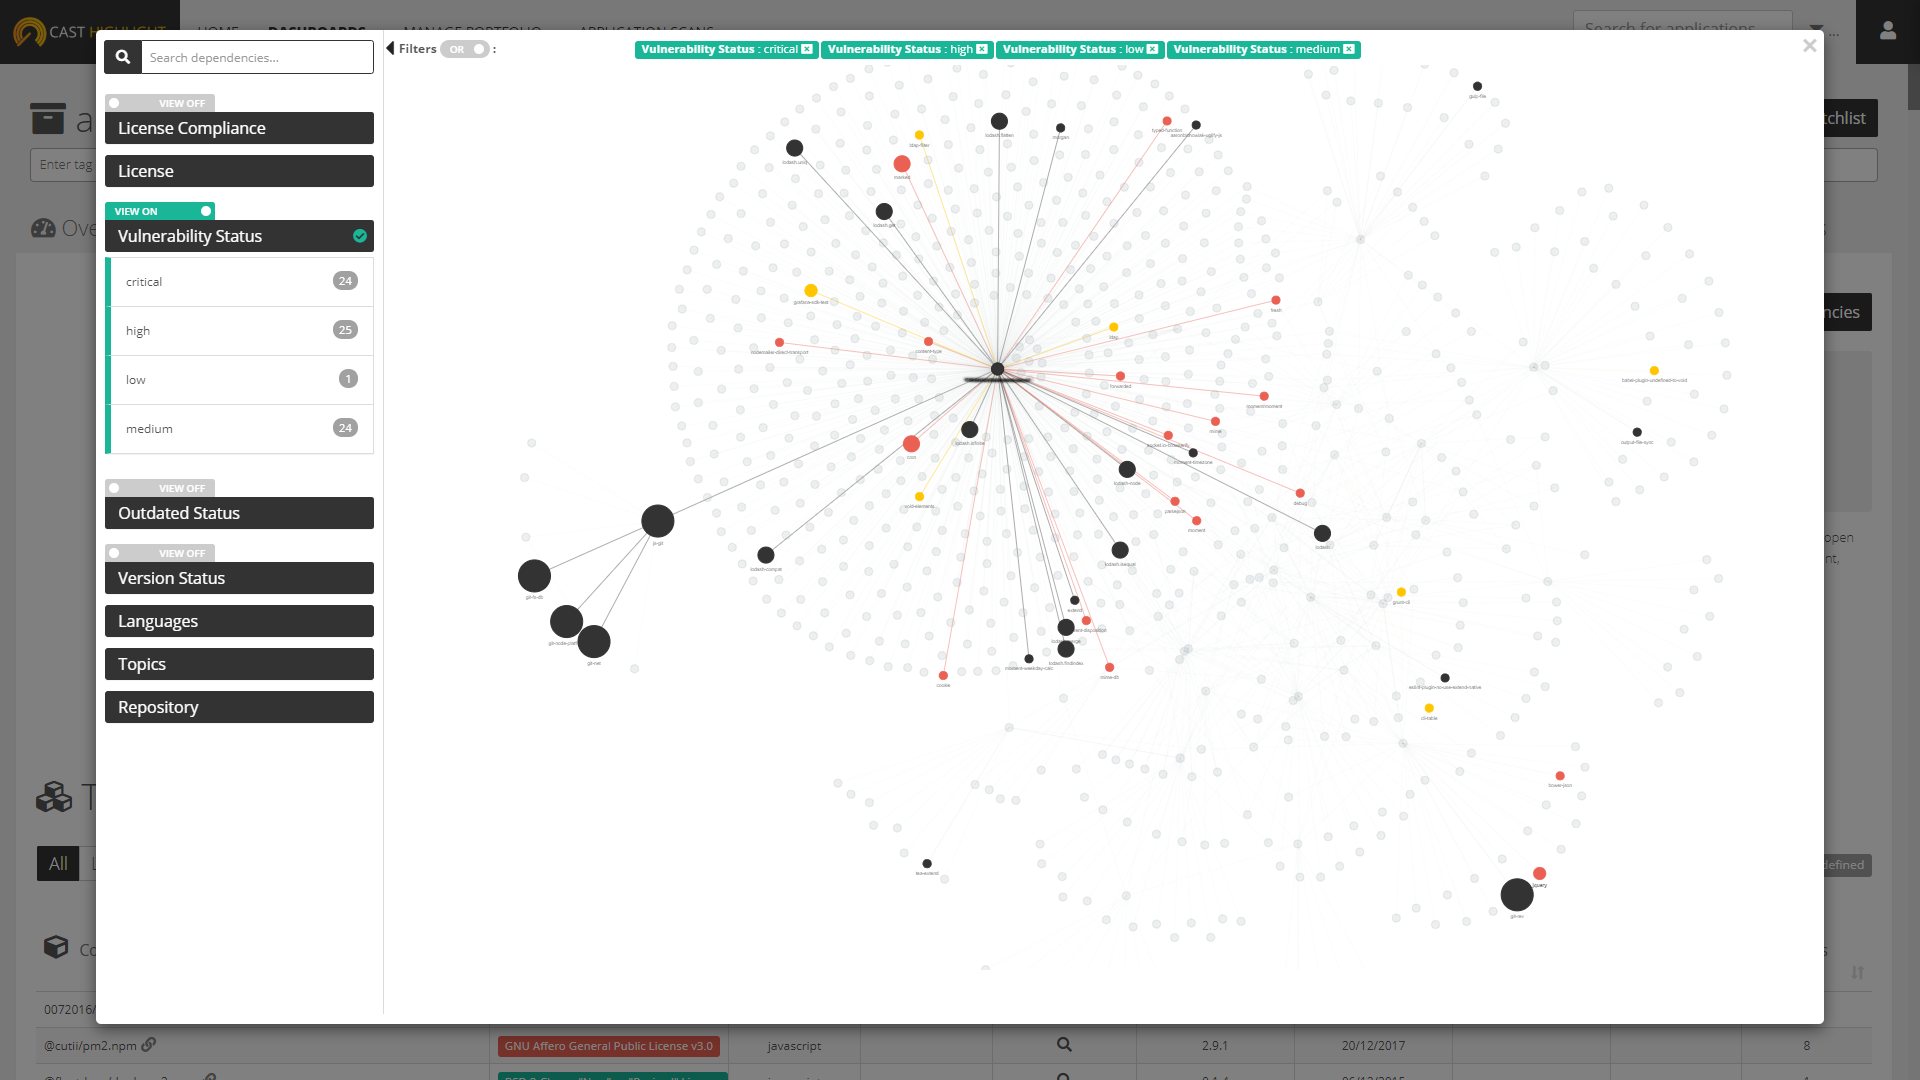
- Vulnerability Status: activating this View will change both the node size (depending on the total number of possible CVEs) and the color (based on the worse/highest criticality of identified vulnerabilities).
- Outdated Status: this View will change node sizes depending on the number of versions.
- Version Status: activating this View will color nodes depending on the component version status, whether it’s an alpha, beta, release candidate, etc.
AND vs. OR filtering
Filters can be used with two logical conditions, AND or OR:
- The OR logic will highlight nodes by cumulating filter criteria. This logic can be used when you want to set up a large list of risky components, generally speaking. E.g. display all the components that are exposed to critical CVEs or under an Affero GPL license or outdated or coming from NPM.
- The AND logic is more restrictive and highlights only nodes that meet all your criteria. You can use it to cluster a set of dependencies matching specific criteria. E.g. display all the components that are exclusively written in JavaScript and with both critical and high severity CVEs.
Ultimately, the combination of Views and Filters will quickly help you focus on critical hotspots within your software.
Alternatively, if you already know the component you’re seeking (e.g. apache-poi), the dependency search on the top left of the screen will highlight all nodes that contain the string you type.